What is ROE or Return on Equity?
Return on Equity (“ROE”) is a metric which measures a firm’s financial performance and it is calculated by dividing net income by shareholder’s equity. This metric is typically expressed as a percentage. Since shareholders’ equity can be expressed as assets minus debt, ROE is considered the return on net assets. ROE tells us how effectively management is using a firm’s equity capital to generate profits.
ROE provides us an easy way to evaluate investment returns. ROE can also help provide insights into how effectively a firm’s management is deploying financing from equity to grow the business.
An increasing ROE over time signals that a firm is reinvesting its earnings wisely which in turn leads to higher productivity and profits. On the other hand, a declining ROE could mean that the management is making poor decisions by reinvesting capital into unproductive assets.
Key Takeaways
- ROE measures the profits made for each dollar from common shareholders’ equity.
- What is considered a “good” ROE will depend on what the median range is for the firm’s peers.
Return on Equity Formula
Return on Equity can be calculated using the following formula:
ROE = Net Income / Average Shareholder’s Equity
Before proceeding, it’s worth noting that many of these terms have precise financial meanings, which might differ from their commonsense usage.
- Net Income is the total income generated, net of expenses and taxes, over a period of time.
- Shareholder’s Equity is defined as the owners’ residual claim on assets after all debts have been repaid. In other words, shareholder’s equity is equal to a firm’s total assets minus its total liabilities.
Most analysts follow an industry best practice of using average shareholder’s equity over a period of time. This is to negate the mismatch caused by differing income statement and balance sheet reporting periods.
How to Calculate ROE from the Income Statement & Balance Sheet
Suppose we wanted to calculate ROE for Facebook (FB), whose income statement for the year ended Dec.31, 2019 and balance sheet as of Dec. 31, 2019 is shown below.
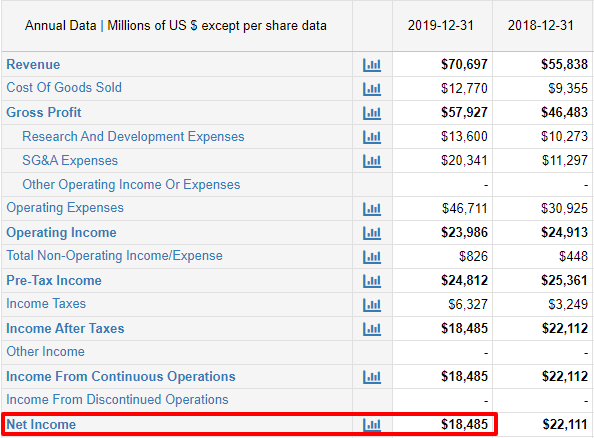
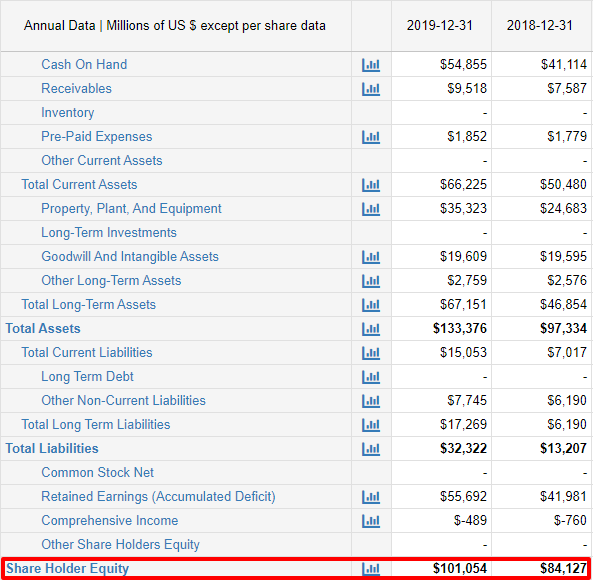
From the income statement, we can easily see the net income value at the bottom of the page. For average shareholder’s equity, all we need to do is take an average of the figure at the beginning and end of the period in discussion.
For Facebook, the ROE can be computed as follows:
ROE = ($18.485B) / (($101.054B + $84.127B)/2) = 19.9%
What is a Good ROE?
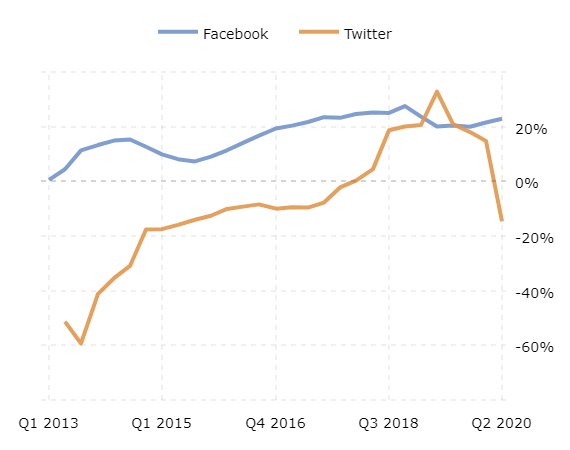
While interesting on its own, it is important to compare a firm’s return on equity with its peer set operating in the same industry. In this case, it would be sensible to compare Facebook’s ROE with other listed social media platforms, such as Twitter.
As is evident from the graph below, we can see that Facebook has registered a higher ROE as compared to Twitter over the majority of the last 10 years. This simply means that Facebook is better at reinvesting its profits into productive assets as compared to its competitors.
Let’s expand and compare the ROE of Facebook with a secondary peer set comprising of other content and internet companies such as Alphabet (GOOG) and Yelp (YELP):
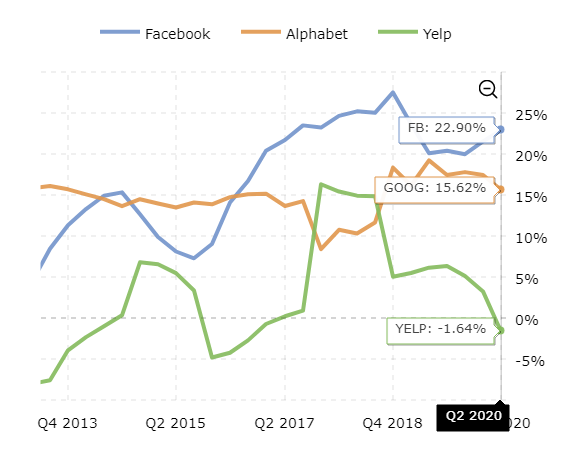
Source: Macrotrends
Once again, we can observe though FB lagged some of its peers from Q4 2013 till about Q1 2015, since then it has steadily grown its ROE to outperform its peers today.
Breaking Down ROE – The DuPont Model
The DuPont analysis, also known as the DuPont model, is a framework for analyzing fundamental performance popularized by the DuPont Corporation. DuPont analysis is a useful method to help dissect and individually assess the different drivers of ROE. The decomposition of ROE allows investors to focus on the key metrics of financial performance individually to identify strengths and weaknesses, thus providing a more holistic view of the business cashflows.
Let’s break down the components that drive ROE below:
- Operating efficiency: Represented by net profit margin or net income divided by total sales or revenue.
- Asset use efficiency: Measured by the asset turnover ratio (Net sales / average assets).
- Financial Leverage: Measured by the equity multiplier (Average assets / average equity).
Dupont Model = Net Profit Margin * Asset Turnover Ratio * Equity Multiplier
Where:
Net Profit Margin = Net Income / Revenue
Asset Turnover Ratio = Sales / Average Total Assets
Equity Multiplier = Average Total Assets / Average Shareholder’s Equity
As you can clearly see, the above split is just an expansion of the ROE formula. Simply monitoring the ROE would tell us how well a firm is utilizing its shareholder’s equity. However, the DuPont analysis goes a step further to question the driving factors of ROE, and help understand why a particular ROE would be considered high or low.
In other words, a DuPont analysis would help an investor understand whether it is profitability, asset deployment, or debt that is driving ROE.
Though expansive, the DuPont analysis still relies on accounting methodologies which are susceptible to manipulation. This can be considered as the biggest drawback of this method, and it’s important that investors take note of this. Despite this issue, the breakdown provides a much clearer picture of the balance sheet strength.
So, let’s put all this together and take some industry examples to determine what’s considered an average ROE for different sectors.
Global Automobile Manufacturers:
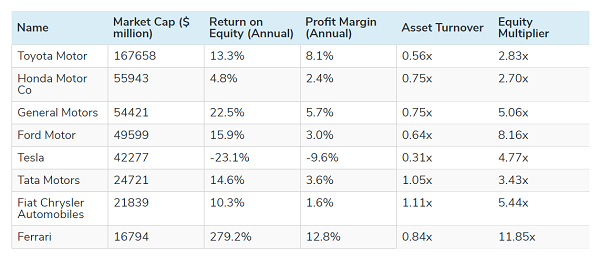
- Excluding the outlier Ferrari, the mean ROE for the sector stands at 8%.
- Ferrari shows a significantly higher ROE (279%) as compared to its peers. This can be attributed to higher profitability (~12.8%) and an extremely high Equity Multiplier (11.85x).
- Though some might consider this an extreme level, on a closer look at Ferrari’s financial statements, one can see that they have an interest coverage ratio of over 20x. So, investors would not be too worried about the leverage given that the debt is appropriately covered by operating cash.
- Here we can see how the DuPont analysis helps us uncover the full story behind Ferrari’s impressive ROE.
- This tells investors that the excessive debt taken by the firm is being used effectively, and that this might be the optimal capital structure for the firm. Large blue-chip corporations are usually able to raise debt at a much cheaper rate compared to small peers.
Beverage Manufacturers
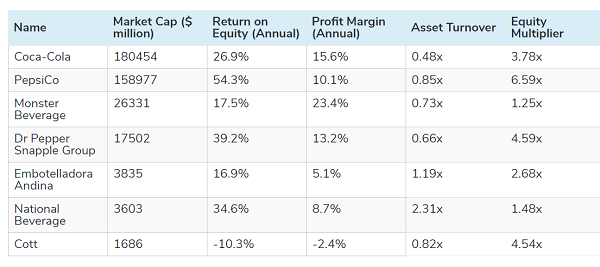
- Overall, the beverage sector showed a healthy ROE (25% on average), much higher than the global automobile manufacturer average of ~8%.
- Though PepsiCo’s profit margin is lesser compared with Coca-Cola, its Asset Turnover and Equity Multiplier are almost double in size, which translates into the higher ROE.
Retail Sector
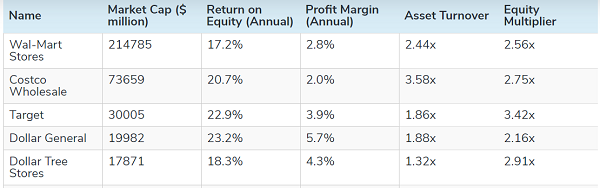
- The average ROE for the sector stood at 20.5%.
- As we can observe, Retail players have extremely low profit margins, since their business model relies on volume, and not price.
- All these players have been able to successfully scale their distribution models with the help of leverage.
- CostCo, with the highest asset turnover ratio, has deployed its assets extremely efficiently, which translates into an above industry average ROE.
- Here again we can see that a DuPont analysis helps us in making the best choice for an investment. If one were to only look at ROE, they would argue that Dollar General would make the best investment, since it has the highest ROE amongst its peers. However, on closer look, we can see that CostCo is much more efficient at deploying its assets as well as debt.
Oil and Gas Sector
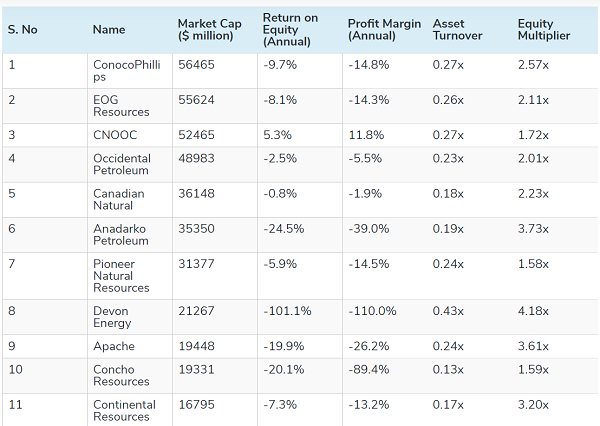
- We notice that almost all companies in the Oil & Gas sector have a negative ROE. In such a scenario, computing an average ROE for the industry would be meaningless.
- The reason for this is the downturn in the commodities cycle, with oil prices crashing to new lows. The global pandemic has further put in doubt the demand for oil going forward.
- A lot of firms are highly leveraged, and may not be able to survive a prolonged downturn in the cycle.
As we have seen from the industry examples above, ROE differs for companies in different sectors, and what is considered normal for one sector may not be the case for another. The DuPont analysis takes ROE a step further and tells us whether it is the leverage, profit margin, or asset deployment efficiency driving ROE.
Return on Equity vs. Return on Invested Capital (“ROIC”)
While ROE measures how effectively a firm is deploying its shareholder’s equity, Return on Invested Capital (ROIC) goes a step further. ROIC is used to find out the amount of money, after dividends, a firm generates from both its source of capital – i.e. equity as well as debt.
ROIC Formula
The general formula to calculate ROIC is given as
ROIC = (Net Operating Profit After Tax (“NOPAT”)) / Total Invested Capital
Before proceeding, it is worth noting that many of these terms have precise financial meanings, which might differ from their common-sense usage.
- NOPAT is defined as net operating income less taxes. The formula for this is EBIT * (1 – tax rate)
- Total Invested Capital is the total amount of long-term debt plus total amount of equity, common and preferred.
Investors should be aware about the differences between ROE and ROIC to remove the risk of confusing the two.
To begin with, ROE helps investors to calculate the profit that a company is expected to produce through shareholder’s equity. On the other hand, ROIC lets the investor calculate out the money a firm makes through all sources of capital.
ROE helps investors to check a company’s proficiency when it comes to utilizing shareholders equity. ROIC helps determine the effectiveness of a company to use all available capital to generate income. A company’s growth prospect plays an extremely important role in determining its profitability. Investors must develop ways to check the same before committing their investment funds.
ROE and ROIC will differ widely for businesses that employ a lot of leverage from those that don’t. For example, banks earn a very low Return on Assets (ROA) because they only earn a small spread( i.e. they may borrow at 1%, and lend at 2.5%). The best banks in the US earn ~3% ROA. But because these banks have the majority of their capital structure in depositors’ money, i.e. low interest-bearing debt, leverage magnifies their returns. So, a bank earning a 3% ROA could easily earn a 25% ROE.
The story would be different for software manufacturers, as they do not need to use leverage to make high returns. Microsoft, in its former heyday, was selling Windows at net profit margins of 25% and turning over its entire inventory almost twice a year, thus earning an almost 50% ROE with minimal leverage. If Microsoft had access to cheap bank-like leverage, its ROE would have been even higher.
With that said, ROE is still a more useful metric to look at in the majority of cases. Assuming, of course, that you compare companies in the same industry with similar amounts of leverage.
High Vs Low ROE
So, is a high ROE always a good thing and a low ROE always a negative? Not really. There are many other important aspects to consider before arriving at a conclusion. For example, to increase the ROE, we would need to increase net income. But what if this could be done without an improvement in business operations & efficiency?
There are many accounting tricks which may help with this. For instance, sales revenue might be recognized earlier than usual, and depreciation policies can have an impact on the bottom line if the firm uses older assets to decrease its depreciation expenses.
Another way the ROE can be manipulated is by adjusting the equity items. How is this possible? Well, imagine if a firm uses external bank loans to pay dividends or buyback its shares. This action would reduce the shareholder’s equity without a change in net income.
In conclusion, a high ROE isn’t always a good thing and a low ROE is not necessarily a bad thing. Deep analysis of other financial metrics is critical to arrive at a correct conclusion.
Drawbacks to ROE
Though ROE is a strong tool for assessing a firm’s financial efficiency, it does have its share of limitations. A subjective ROE reading can help uncover structural underlying issues with regards to the firm’s operations. For instance, excessive debt levels and inconsistent profits might be identified, amongst others.
Similarly, a negative ROE arising due to a net loss or negative shareholder’s equity does not prove to be useful for analyzing a firm’s performance. Apart from the reasons stated above, ROE sometimes tends to overstate a company’s economic value, which is dependent on various economic factors. The following is a list of variables affecting the ROE:
- Depreciation: A high rate of depreciation leads to a lower net income and in turn, lowers the ROE significantly.
- Investment Growth Rate: Rapidly growing companies require substantial amount of capital, which tends to lower ROE.
- Gap between Capex and Realized Benefits: The degree of overstatement is also dependent on the time taken by a firm to recoup its investments in terms of profit.
ROE is surely an important metric for comparing similar companies. It has been seen as one of the best ways to identify stronger companies historically, and has many use cases, especially when you break the metric down via the DuPont Method.