What is the Gross Profit Margin?
Gross profit margin measures the amount of revenue retention after accounting for costs linked with the production of goods and/or services. The higher the gross profit margin, the more profit a company retains on each dollar of revenue generated. In other words, gross profit margin for a firm is equal to the result of its financial output, net of variable costs. The gross profit margin will vary widely by industry and company size and can be impacted by a multitude of factors.
Key Takeaways
- Gross profit margin equals net revenue minus the cost of goods sold (“COGS”), which includes direct materials, labor and equipment costs involved in production as well as utilities expenses related with operating the production facilities
- Gross profit margin indicates the amount of profit made before deducting selling, general, and administrative costs
Gross Profit Margin Formula
Gross profit margin is calculated using the following formula:
Gross Profit Margin = (Revenue – COGS) / Revenue
- Revenue refers to the amount of money a company receives in exchange for its goods and services or conversely, what a customer pays a company for its goods or services. The revenue received by a company is usually listed on the first line of the income statement as revenue, sales, net sales, or net revenue
- COGS, also referred to as cost of sales/services, is the amount of money required to manufacture the goods or services for sale. It must include all direct expenditures including materials and labor related with the production costs. COGS should not include any indirect expenses, such as overhead costs, selling, general and administrative expenses.
Though COGS is reported directly by almost all companies, we can also use a formula to calculate this ourselves.
COGS = Starting Inventory + Purchases During the Period – Ending Inventory
The starting inventory refers to whatever inventory was left over from the previous period. To that we add the cost of the purchases we made in the year, and then finally we subtract whatever inventory we were unable to sell by the end of the period in consideration.
How to Calculate the Gross Profit Margin from the Income Statement
Suppose we wanted to calculate the gross profit margin for Apple (AAPL). By market cap, Apple is the largest North American public company in the world, and is considered to be a staple in tech, services, and consumer goods. Let’s take a look at the Apple income statement for the 12 months ending September 30, 2019:
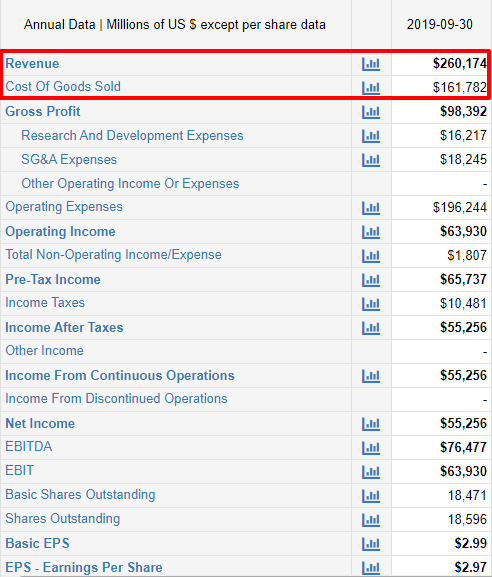
The calculation for gross profit margin is quite straightforward. Using our formula, we can calculate the gross profit margin for Apple as follows:
Gross Profit Margin = (Revenue – COGS) / Revenue
= ($260.174B – $161.782B) / $260.174B
= 37.81%
Let us now compare Apple’s performance to its peers, to get an idea where it stands in the industry with regards to gross margin profitability. The screenshots below show the gross profit margin for three other big tech names that also produce consumer products, and are considered to be some of Apple’s biggest competitors: Microsoft, IBM, and HP.
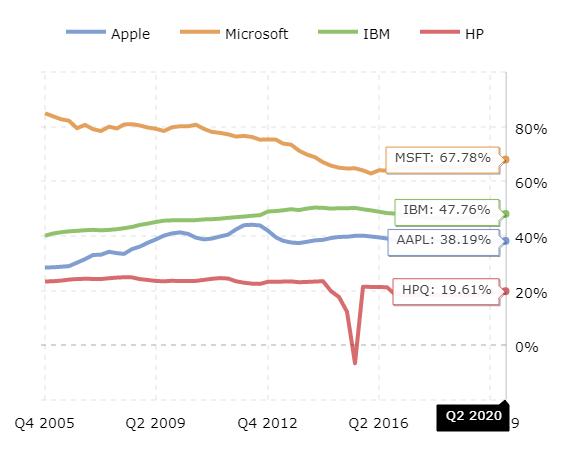
As we can see from the above screenshot, Apple, although the largest company in the world in terms of market cap, and an industry leader, has a lower gross profit margin than both Microsoft and IBM, and is only higher than HP. Microsoft has the highest profit margin compared to its peers, meaning that Microsoft retains more money on each dollar of revenue.
However, the gross profit margin does not tell us the whole picture. It would be important to also compare operating and net profit margins for these companies. This is because there could be significant indirect costs which would only be known by comparing operating margins and net profit margins.
So, let us compare the operating margins of the players in the tech goods and services segment, to get a holistic picture of their annual performances.
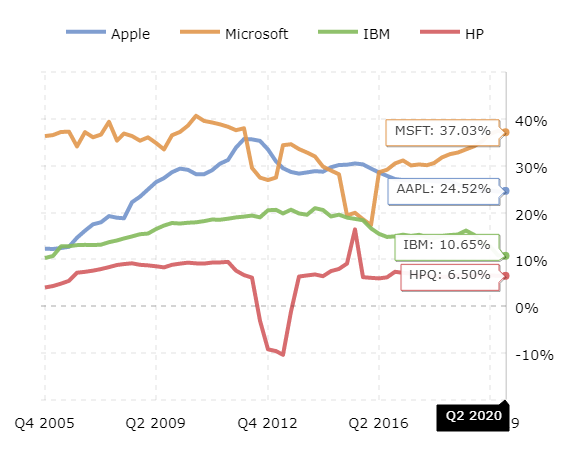
As we can see from the above image, Apple’s operating profit margin ranks second amongst its peers. While Microsoft’s operating profit margin still ranks first, what is interesting here is that not only is Apple ranked second, but their operating profit margin is over double that of IBM’s, and nearly quadruple that of HP’s. While IBM’s gross profit margin was marginally better than Apple, their operating profit margin is considerably worse than Apple. This indicates that they could have considerably more operating expenses than Apple and are not doing as good a job as Apple when it comes to retaining profit from their day to day operations.
What is a Good Gross Profit Margin?
As we have discussed in the previous section, it would not be prudent to compare gross profit margins across industries given that there can be a significant difference in the capital required for operations. To prove this point, let us examine the gross profit margins for a set of companies operating in the technology sector, more specifically, those that create application software.
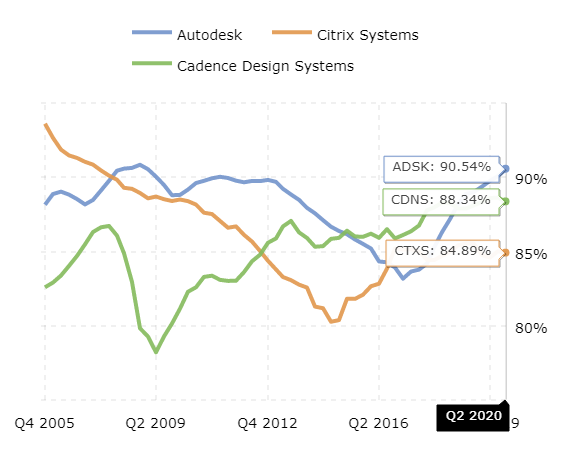
As we can see, these technology companies all have gross profit margins in excess of 84%. This is simply because companies offering Software-as-a-Service (“SaaS”) don’t need to manufacture / design the service again and again to make a sale. Once it has developed its software offering, it can keep selling licenses to it over and over again. Hence their cost of sales is extremely low, leading to high gross profit margins.
On the other hand, other capital-intensive manufacturing businesses have significant variable overhead costs associated with production of goods and hence their gross profit margins will understandably be lower in comparison.
A decreasing gross profit margin over the years tells us that the firm is generating lesser gross profit from its revenue and is therefore less efficient at converting raw materials and labor into revenue. This would mean that it now has that much less money to put towards indirect expenses. This might indicate some problems within the company such as overpriced production inputs or underpriced products.
It is best to stick with the same industry when comparing companies based on gross profit margins. Companies with margins above the industry average can be shortlisted for further evaluation before an investment decision is made.
Gross Profit Margin vs. Operating Profit Margin vs. Net Profit Margin
So how does gross profit margin compare with regards to usefulness when compared with operating and net profit margins?
Let us start out by listing the pros for using the gross profit margin metric. It is an extremely simple and straightforward metric to calculate. It instantly tells us how efficiently a firm manufactures and distributes its products. The gross profit margin makes it easy to estimate future cash flows to a firm. The biggest negative about the metric is that it is the least comprehensive of the 3 metrics. It does not factor in important indirect costs (i.e. salaries, SG&A and interest expenses) which can have a huge impact of the overall profitability of the firm. The metric can also be misleading, as was showcased in the example above.
Let’s move on to the operating profit margin. It is a more comprehensive metric compared with the gross profit margin and this one considers the important indirect costs associated with running a business operation. This metric tells us how efficiently a company is deploying all its available resources to generate a profit. The biggest drawback of this metric is that it does not include interest and taxes, which can be misleading when we are evaluating a highly leveraged company.
The final metric, net profit margin is considered to be the most comprehensive profitability metric. This margin measure considers all indirect costs as well as interest and tax payments. It is the most conservative metric out of the three and the only one which can be used as a standalone metric to measure profitability.
Drawbacks to Gross Profit Margin Metric
The gross profit margin is one of the most utilized metrics when evaluating the performance of a company over a period of time. It looks to compare the total sales generated to the cost associated with manufacturing those goods for sale. Higher the margin, the more efficiently the company is manufacturing goods. However, despite its usefulness, the gross profit margin has a few drawbacks which investors should be aware of:
- Other important expenses: Some would argue that the biggest issue with the gross profit margin is that it only covers the variable and direct costs incurred during the manufacturing process. While this could provide investors with some information about the operations, it leaves a wide selection of other important expenses that need to be evaluated, including salaries, taxes, interest payments and other potential indirect costs. This is why it becomes important to examine both gross profit margin as well as net profit margin.
- Sales calculation: The formula used to create gross profit margin can sometimes be a little tricky. For the most part, revenue is easy to calculate or find on a balance sheet. However, that is not always the case. The company will need to decide whether to include all sales including those in accounts receivable, or only sales that have been completely paid for. Choosing which costs do and do not directly impact production can also be difficult for many companies as this could lead to a distortion in the gross profit margin.
- Variance across industries: The gross profit margin can vary significantly across industries, which can make it difficult to compare across sectors. Let’s take the case for the airline industry, which has high direct costs like jet fuel. Such companies might have an exceptionally low gross profit margin. On the other hand, the technology industry might have a gross profit margin as high as 80% since its production costs are so low. Hence it becomes vital to ensure that the gross profit margin is only compared for companies operating in the same industry.