A balance sheet is how a company expresses how much it owns on a certain date, how much it owes, and how much is left for the investors to call their own.
While its income statement and cash flow statement are of prime importance to the company’s shareholders — because they reveal the company’s profitability over a period of time — its balance sheet is of more importance to stakeholders who are less concerned with profitability and more concerned with other metrics. Bondholders and lenders, for example, will want more detail on what the company has that can be used as collateral. The company’s suppliers — who want to know how well-capitalized it is so they determine how much credit to extend — would also be keenly interested.
The balance sheet is predicated on one fundamental truth: When you add up the value of everything a company possesses, subtract out everything it owes, then what you’re left with is the net worth of the company — the portion the shareholders have a right to. Rendered arithmetically:
Assets – Liabilities = Owners’ Equity
or
Assets = Liabilities + Owners’ Equity
So the “balance” in balance sheet is that assets on the one side equate to liabilities and owners’ equity on the other — by definition to the penny.
Key takeaways
- A balance sheet is a point-in-time assessment of what a company owns, what it owes and the remainder that can be claimed by shareholders.
- Assets must equal the sum of liabilities and owners’ equity.
- Liquidity, leverage, rate-or-return and efficiency metrics can be gleaned in whole or in part from data presented on a company’s balance sheet.
- Off-balance sheet notes describe liabilities and assets that, due to compliance standards, are not reported in tabular format; OBS tricks are also used perniciously to hide debt
Balance sheet defined
A balance sheet reports a business’s assets, liabilities and owners’ equity at a point in time, typically the end of a reporting period. It is comprised of:
- Assets: Items of cash value owned by the company
- Current Assets: Those assets which are most easily converted to cash
- Long-term Assets: Those assets which can’t be converted to cash within a year
- Liabilities: The money a company owes to others.
- Current Liabilities: Those liabilities which must be paid within the year
- Long-term Liabilities: Those liabilities for which payment is not due within the year
- Shareholders’ Equity: the value of the business to which shareholders are entitled should they liquidate the business, sell off its parts and pay off its debts; the value of Assets net of Liabilities
Balance sheet template
Macrotrends employs a template that standardizes the specific lines under the above headings. Per longstanding custom, it lists assets in order of liquidity and liabilities in order of how soon they must be paid off. We use the example of game developer Zynga:
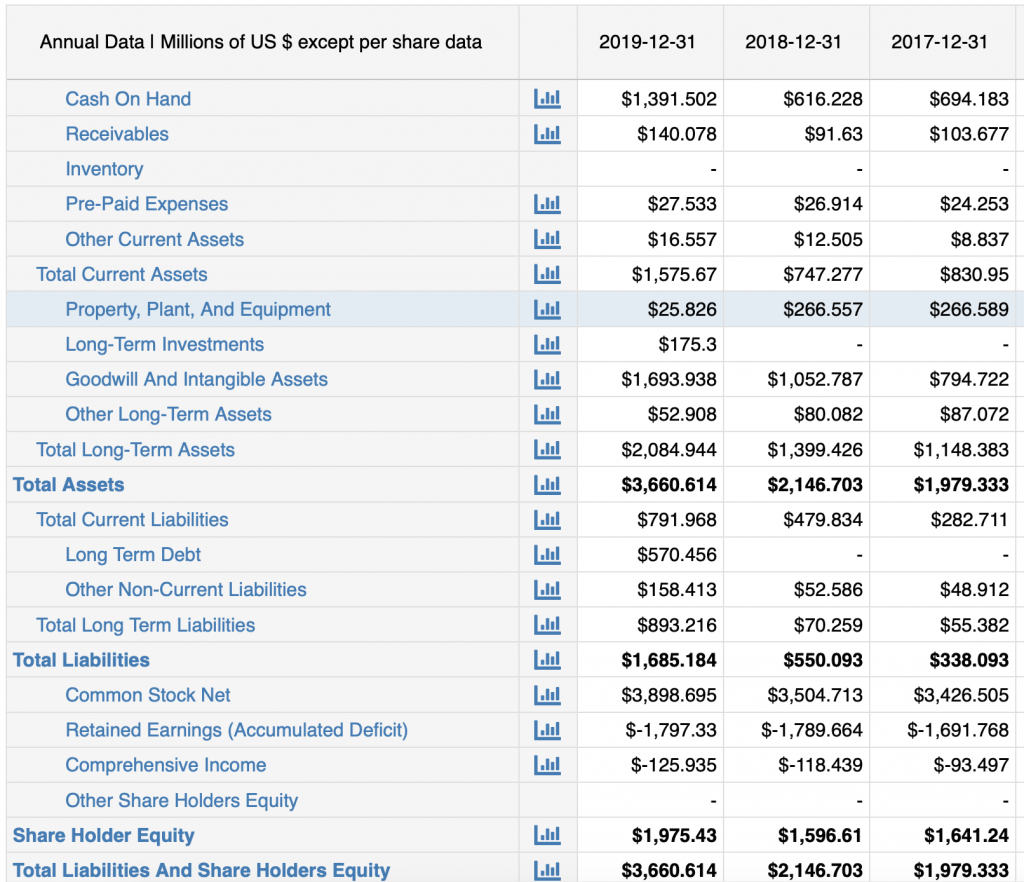
You’ll see that Current Assets are further deconstructed into the following line items.
Cash on hand: Money held in the company’s bank accounts, plus foreign exchange, Treasury bills, certificates of deposit, marketable securities held in a brokerage account and — to the extent this is still a thing — uncashed checks
Receivables: Money owed by clients that is expected to be paid back within the year
Inventory: Both the finished products available for sale and raw materials necessary to create those goods
Prepaid Expenses: Things of value already paid for, such as the current month’s rent or the yet-to-be-used portion of a software license
Other Current Assets: A catch-all that covers anything not delineated above
You’ll also see that Long-Term Assets are deconstructed as:
- Property, Plant & Equipment: Land, buildings, machinery, office equipment and other durable goods
- Long-Term Investments: Securities a company has purchased as strategic assets and is unlikely to sell within the year; these are often holdings in other businesses in which the company has a non-controlling interest
- Goodwill and Intangible Assets: When one company buys another, it generally pays more than the target’s balance sheet would suggest it’s worth, because the company is also buying management talent and the promise of future cash flow; this excess is called “goodwill” in accounting. Goodwill is just one type of asset that isn’t a physical object; intellectual property and brand recognition are other intangibles. The reason this is considered the most illiquid class of assets is because it is the hardest to value; most company executives would concede that their total figure on this line is significantly overstated or understated.
- Other Long-Term Assets: A catch-all that covers anything not delineated above
Current Liabilities aren’t broken down in granular detail on Macrotrends’ template, but they include rent, utility and other accounts payable; tax bills; payroll; and the portion of long-term debt that is intended to be serviced in the next 12 months. It also includes pre-payments — for example, if you received a $50 gift card and only bought $10 worth of merchandise, then the retailer must consider the other $40 a current liability, sometimes called “revenue earned in arrears”.
Long-Term Liabilities are divided into:
- Long-Term Debt: The portions of loans and securitized debt that need not be paid back within the next 12 months; this includes both principal and interest
- Other Non-Current Liabilities: Deferred income tax, pension fund liabilities and all other long-term obligations
Shareholders’ Equity, sometimes called net assets, is the value that actually belongs to the company’s shareholders. But it’s not a simple matter of subtraction.
Common Stock, Net: The difference between the values of common stock issuance and repurchase/retirement.This portion of equity, often called treasury stock, can be sold to raise cash if need be.
Retained Earnings: A company’s accumulated profits, increased (or decreased) periodically by newly reported net income (or loss); it is a pool of money available for spending on capital expenditure, R&D, M&A, retiring debt or any other internal function, as opposed to spending on dividends.
Comprehensive Income: Similar to Retained Earnings, but refers to gains or losses of cash from financing or investing activities rather than operations
Other Shareholders’ Equity: A catch-all that covers anything not delineated above; it might include net issuance of preferred stock, additional paid-in capital or capital surplus
Adopting the widely accepted template shown above provides readers with apples-to-apples points of comparison between companies that might break out their assets and liabilities in greater detail or with different nomenclature.
Balance sheet ratios
A company’s balance sheet is intended to give stakeholders transparency into four crucial dimensions of its fiscal health, each with its own ratios that enable comparison with industry peers:
| Category | Description | Metrics |
| Liquidity | Ease of conversion to cash | Current ratio, quick (acid test) ratio |
| Leverage | Degree of indebtedness | Debt-to-equity ratio, debt-to-total-capital ratio |
| Rate of Return | Effectiveness in generating earnings | Return on equity, return on assets |
In addition to providing clarity on a company’s liquidity, leverage and rate of return, balance sheet data can also inform analysts as to its operational efficiency. Those indicators of how well the business deploys its working capital, though, are more involved and will be discussed in a separate post.
For now, let’s consider the liquidity ratios. The current ratio is the easier to calculate:
Current Ratio = Current Assets / Current Liabilities
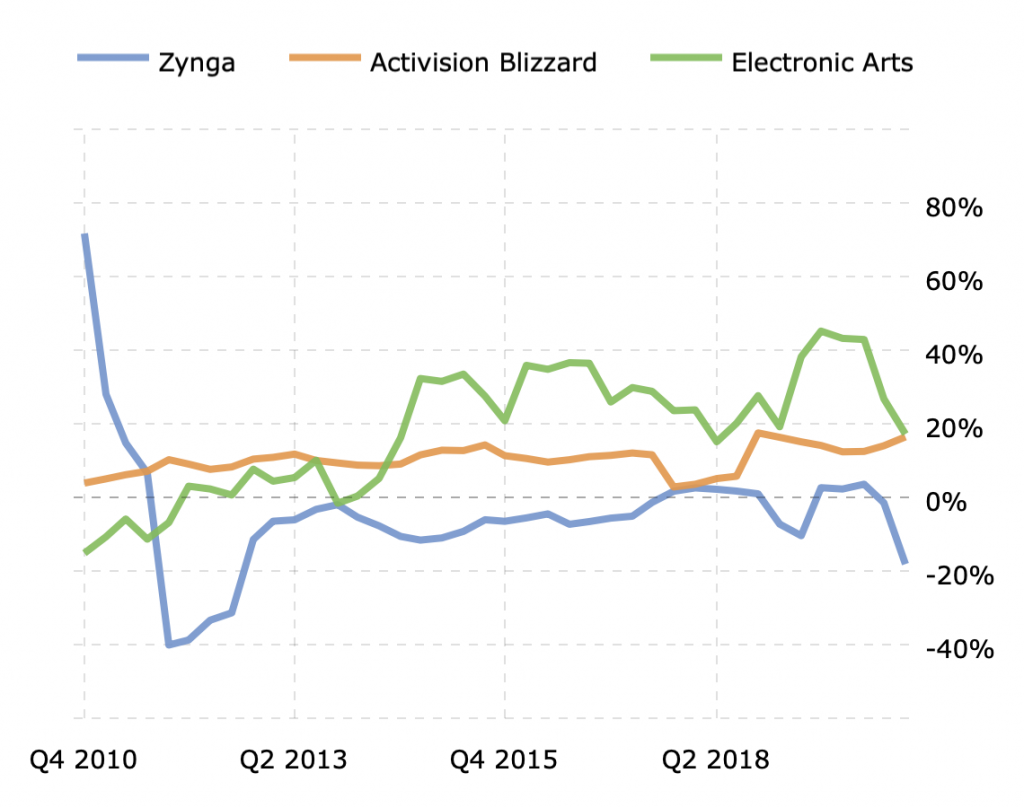
In Zynga’s case, we divide $1.576 billion in current assets by $0.792 billion in current liabilities to arrive at 1.99. This suggests that if, on December 31, 2019, the company was called on to pay off all its short-term debt, it could do it twice over. Whether that’s a “good” number or not depends on what you’re comparing it to. According to Macrotrends, the entire S&P 500 taken as a whole has an aggregate current ratio that hovers between 1.15 and 1.20. Compared to the broad market for large-cap stocks, then, Zynga did very well. But how did it do against its industry peers? Let’s compare Zynga’s current ratio to those of Activision Blizzard and Electronic Arts:
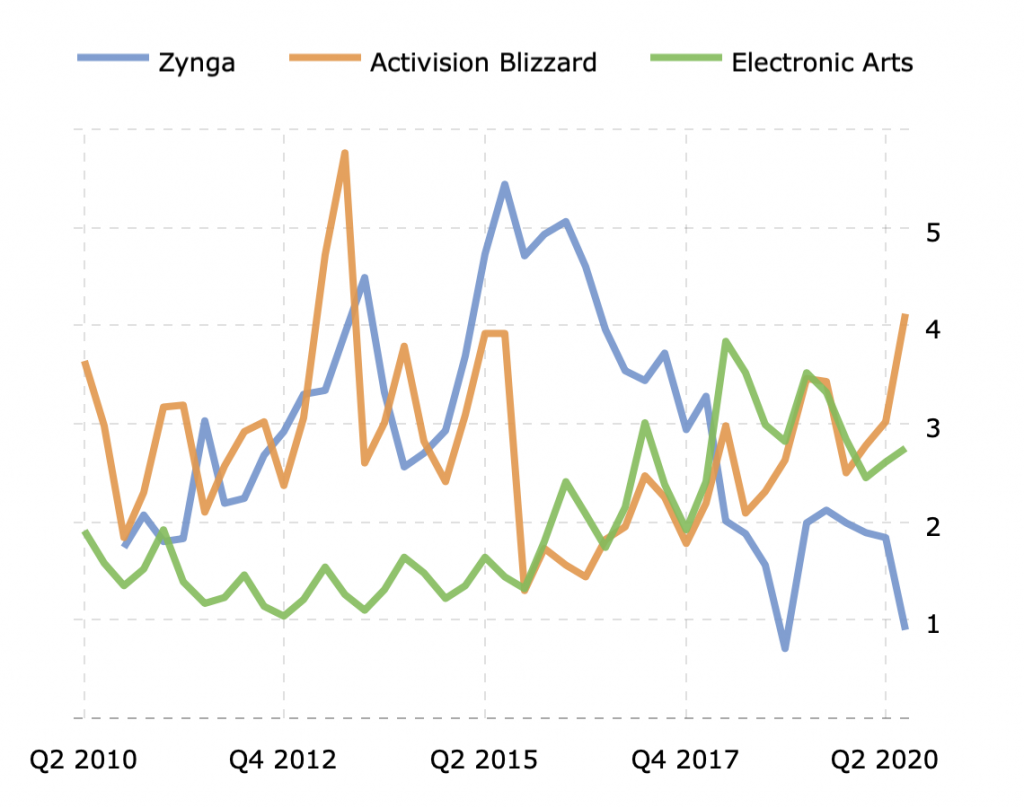
In 2015-2016, Zynga was apparently much more liquid than its two competitors although, in the years since, both Activision Blizzard and Electronic Arts have improved their current ratios. Meantime, Zynga’s liquidity has lagged.
Still, current ratio isn’t the only metric — or even the most instructive one — for determining a company’s liquidity. While the quick ratio — often called the “acid test” — involves a little more parsing of the data, it provides a much more conservative measure.
Quick ratio = (Cash + Accounts Receivable) / Current Liabilities
There’s a little more nuance to the formula, but that’s the gist. A company can spend cash. It can collect its receivables in short order or, if it needs money immediately, it can sell those invoices to a third party — at a discount, but the company can still get that cash by the next business day. But it takes longer to sell inventory, the prepaid expenses have already been spent and the “Other Current Assets” are a mixed bag, some of which could take up to a year to monetize. But companies like Zynga — 100% digital so they don’t have to deal with inventory — tend to shine by this metric. If you add $1.392 billion in Cash and $0.140 in Receivables, then divide the sum by $0.792 billion in Current Liabilities, you arrive at a quick ratio of 1.93. Considering that the broader market’s quick ratio is around 0.74, that speaks well of Zynga’s liquidity.
Turning our attention to leverage, we turn to the debt-to-equity ratio (DE), which is expressed:
DE = Total Liabilities / Shareholders’ Equity
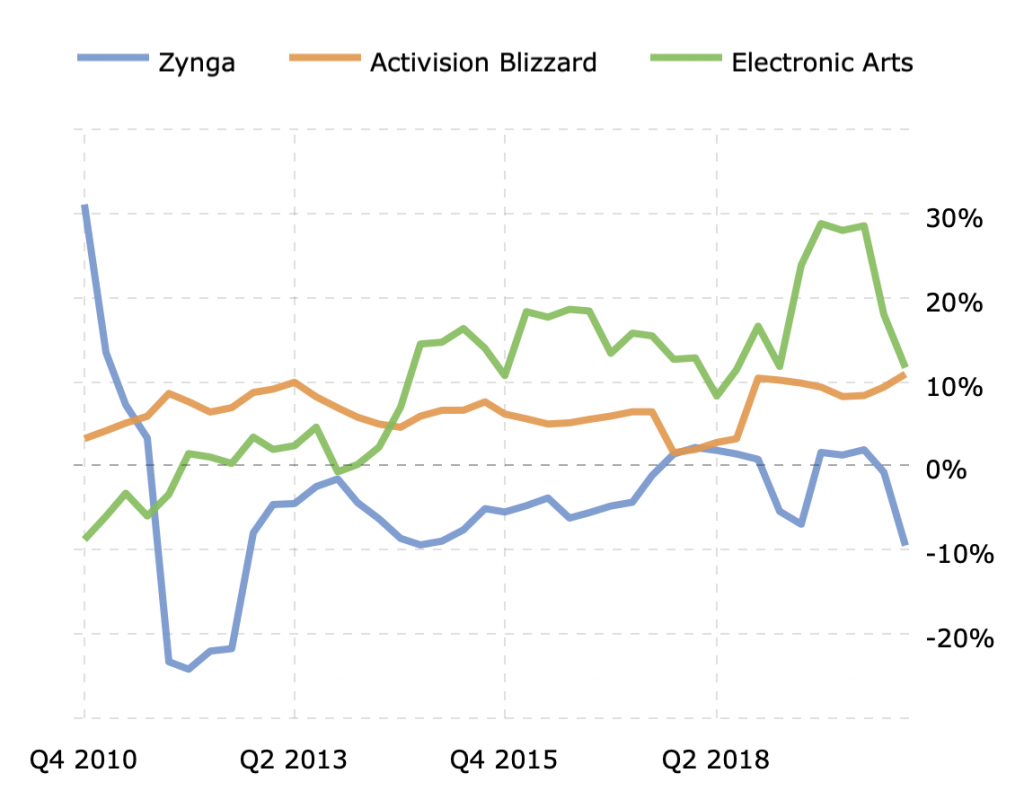
To solve for Zynga’s DE, then, we would divide the company’s $1.685 billion in Total Liabilities by its $1.975 billion in Shareholders’ Equity to arrive at 0.85. Let’s see how that compares with its peers’:
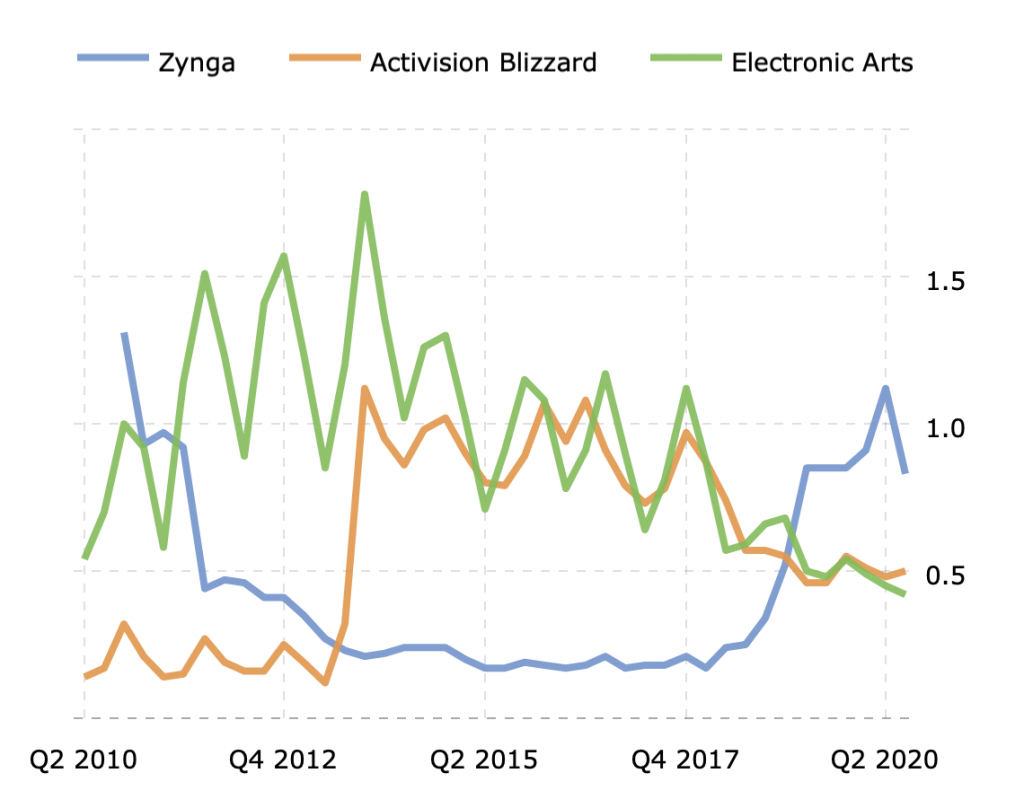
In recent years, it appears that Zynga has become more highly leveraged as other developers have become less so.
By convention, DE is the most commonly used leverage gauge, but it’s not the most intuitive. That’s why many analysts prefer the debt-to-total-capital ratio, which expresses debt as a percentage of the entire capital stack:
Debt to total capital =
Total Liabilities / (Total Liabilities + Shareholders’ Equity)
Using the same values we used above, we determine that Zynga’s debt-to-total-capital ratio is 46.04. That means the company is funded 46.04% by debt and thus 53.96% by equity.
One thing to bear in mind is that debt isn’t necessarily bad. It is generally carries a less expensive cost of capital than issuing equity. That said, the more leveraged a company is, the higher the cost of issuing debt becomes.
Regardless of a company’s capital structure, though, the investor community will judge the value of its securities on its ability to turn the elements of its balance sheet into earnings on its income statement.
Return on Equity (ROE), the most popularly cited rate-of-return metric, measures the company’s ability to make a profit given the value of its Shareholders’ Equity:
ROE = Net Income / Average Shareholders’ Equity
To find the numerator, we need to take a glance at the company’s income statement:
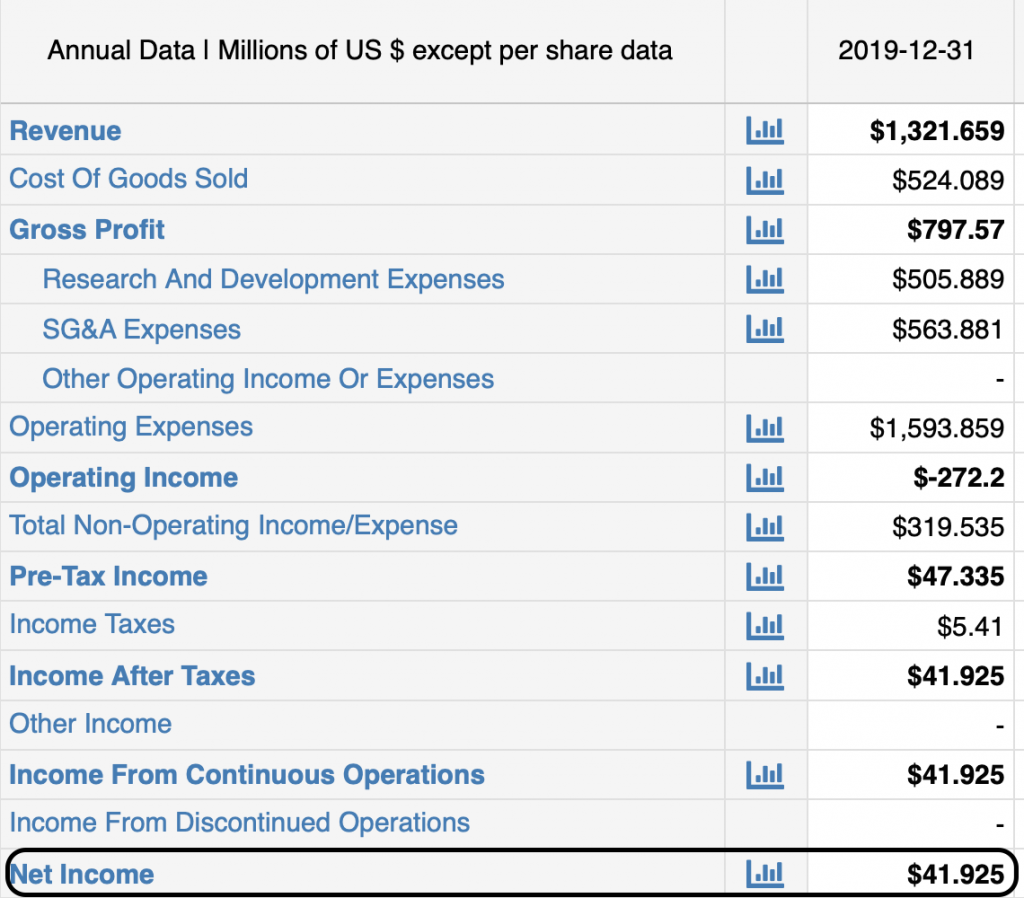
We see from its income statement that Zynga’s Net Income was $41.925 million in 2019. We already know from the balance sheet that its Shareholders’ Equity was $1,974.43 million at the end of the period and was $1,596.61 million at the beginning; the mean average Shareholders’ Equity, then, was $1,786.02 million. Zynga’s ROE, then, was 2.35%. If that sounds light to you, that’s because it is. As a whole, publicly traded companies generally have ROEs between 10% and 15%. Nor does Zynga’s ROE compare favorably with those of other game developers:
Although Zynga offered excellent ROE during the success it initially met with back when its FarmVille game burst onto the Facebook scene, that quickly faded. It has since trailed Activision and EA which, to be fair, are more established companies and operate in the much more lucrative console and PC gaming space. Zynga has, in fact, run losses more often than it posted profits. In the days since the end of its 2019 fiscal year, it continued its habit of negative earnings.

Another way of using the balance sheet to measure weight of return is to apply the same logic and the same math to return on assets (ROA):
ROA = Net Income / Total Assets
While ROE calls for average Shareholders’ Equity, ROA saves analysts a little effort by just using period-ending assets; the total value of assets are, after all, less volatile than that of equity.
So given $41.925 million in Net Income and $3,660.614 million in Total Assets, Zynga’s 2019 ROA was 1.15%. Again, comparisons are not kind:
With returns like that, Zynga might strike you as something of a money pit; it doesn’t seem to be making much money. And yet, if you recall, the liquidity metrics — the quick ratio in particular — were quite strong. It’s important to consider all the dials on the dashboard before leaping to an investment thesis.
“While Zynga does have more liabilities than liquid assets, it also has net cash of US$166.1 million,” according to the Simply Wall Street article that drew our attention to this company. “So we don’t think Zynga’s use of debt is risky.”
The company’s reported income statement
As noted above, all this is based on a template designed to normalize different companies’ balance sheets for side-by-side comparison. While there are accounting standards to follow, they do allow for some degree of latitude for how each business delineates its assets and liabilities.
As an aside, we should note that there are two standard-setting institutions: the Financial Accounting Standards Board, which promulgates Generally Accepted Accounting Principles (GAAP), and the International Accounting Standards Board, which promulgates International Financial Reporting Standards (IFRS). There’s some daylight in between these two sets of rules and, although the SEC has traditionally favored GAAP, the U.S. financial markets regulator is moving toward a preference for IFRS.
Under either regime, though, there is some allowance for how each company drills down on both sides of the balance sheet. Zynga’s 2019 annual report, promulgated to investors and subsequently filed with the SEC, contains this table (denominated in thousands of U.S. dollars):
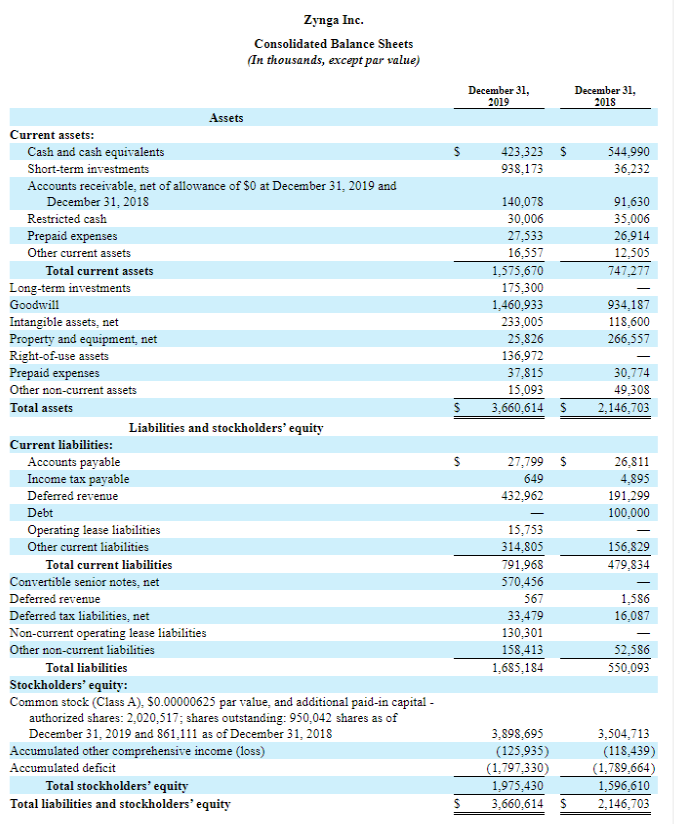
You’ll notice that three lines of Current Assets — Cash and Cash Equivalents, Short-Term Investments and Restricted Stock — are lumped together on the template as Cash on Hand. A similar level of specificity comes from a line-by-line review of Long-Term Assets. You’ll also see that Macrotrends’ template boils down six lines of detail into Total Current Liabilities and three lines into Other Non-Current Liabilities. The two formats’ presentations of Shareholders’ Equity, though are identical.
The game development industry is notable but not unique in that inventory is minimal. But every industry has its quirks as to what assets it needs to list among its assets. Agribusiness players, for example, generally have to break out livestock or produce as Biological Assets.
Similarly, companies with differing financial statuses might need to provide more detail about certain liabilities. Provisions against such contingencies as court decisions or warranties would be included here, as would promissory notes or similar financial liabilities. Also, depending on whether they are positive or negative, provisions for current or deferred taxes might be construed as either assets or liabilities.
Such items as non-controlling interests might also need to be included under Shareholders’ Equity.
A company’s balance sheet also discloses the number of shares authorized and issued, as well as descriptions of the rights, preferences and restrictions governing those shares.
Off-balance sheet accounting
Balance sheets are notoriously easy to game, though. It’s fairly simple to restructure a relationship that looks and feels and behaves like a debt so that it appears to be just another contractual agreement. Because these obligations do not need to be reported as liabilities, they are called “off-balance sheet” or “OBS” items.
Companies might have any number of reasons to hide liabilities, but it mainly has to do with reducing such leverage metrics as DE. The lower this ratio, the more favorable terms a company can negotiate if it needs to borrow.
Assets can be held as OBS items as well. For example, financial stakes in other firms that aren’t directly owned by the company might be legitimately kept OBS. Banks generally don’t keep securitized loans — loans are assets to banks — on the balance sheet.
“OBS” is actually a little misleading a term, because these phantom liabilities and assets must still be listed in the footnotes to a company’s balance sheet, and those footnotes are actually considered part of that financial statement.
Further, OBS items are not necessarily — or even as a general rule — deceptive. Accounting standards or regulatory compliance might actually compel firms — particularly those in the Financial Services sector — to keep items OBS.
In any event, the financial analyst’s job in scrutinizing a company’s balance sheet is not done until the footnotes are understood and translated into the template for ease of comparison.
In Zynga’s case, there was no OBS activity to report.